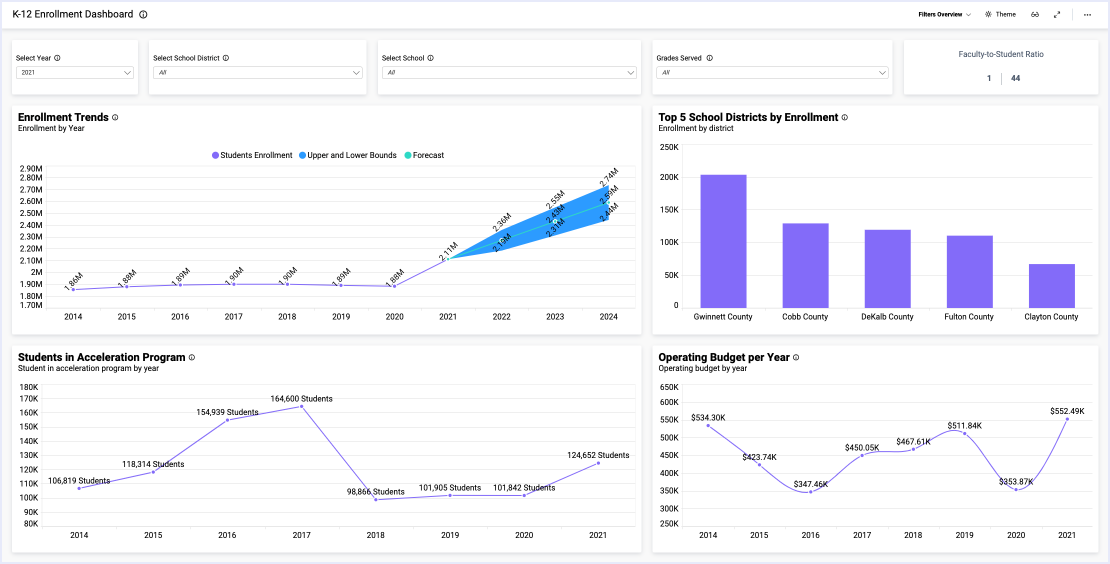
- What is the freshman retention rate?
- How many students attend class?
- What is the student–faculty ratio?
- How much money does the school spend on each student?
- Which demographics make up our student body?
Analyze Key Enrollment Data
Firstly, with this dashboard, we can track the school’s enrollment details by noting the overall attendance percentage. Also, we can see how many freshmen return to school.
This enrollment dashboard further breaks down student data by ethnicity, gender, age, and course of study. With this information, schools can ensure they are providing the resources students need.
Finally, this dashboard also allows administrators to review course completion rates, the amount of money spent per student, and the student–faculty ratio. Crucially, these metrics offer insight into student performance, including how the number of faculty members and the investment per student might boost student achievement.
Filter Your Data
By using the “Year” and “Course” drop-down list box filters, viewers can customize the dashboard to display data for any combination of years and courses of study. For instance, viewers could look at the data for all students in 2019. Similarly, they could display only the data for nursing students in 2018.
Users can reset the filters by clicking the funnel-shaped icons in the upper right corners of the drop-down list box widgets. If both filters are reset so that specific years and grades are not selected, we will see the overall numbers for all students for all of the years for which we have data.
Users can apply these filters to any dashboards that display data across time periods or for separate, defined groups. As can be seen, this can be especially useful for reviewing trends over time.
With this dashboard, for example, we could track enrollment, attendance, and the freshman retention rate over a period of three years to note whether any trends appear.
Smart Dashboard’s dashboards are an invaluable tool not only because of the information they put at your fingertips but also because of the potential connections they allow you to make between data sets.


